Pros and Cons
Pros:- Relatively easy to set up
- Cross-browser (mostly)
- Numbers sometimes spaced to narrow
- Black background in IE (fix below)
- A bit clunky for simple graphs without groupings
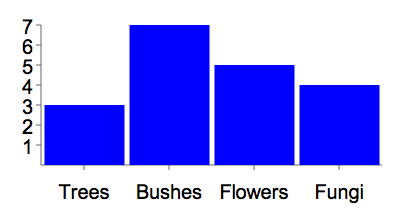
Bar chart example
Ico.js: https://raw.github.com/alexyoung/ico/master/ico.min.jsRapehael: https://raw.github.com/DmitryBaranovskiy/raphael/master/raphael-min.js
<script src="raphael-min.js">This looks a bit overcomplicated, maybe I just don't get how to use it.
</script>
<script src="ico.min.js">
</script>
<script src="https://ajax.googleapis.com/ajax/libs/jquery/1.7.2/jquery.min.js">
</script>
<script>
$(document).ready(function(){
var data = [[3],[7],[5],[4]]; // needs grouping for colors to work
var settings = {
font_size: 20,
colours: ["blue"],
labels: ["Trees","Bushes","Flowers","Fungi"]
};
new Ico.BarGraph(
$("#bar-chart")[0],
data,
settings);
});
</script>
<div id="bar-chart" style="height: 200px; width: 400px;">
</div>
Black background in IE
It doesn't work as well in IE8 though. I'm getting this:
$("#bar-chart shape").first().remove();
